Monitor NodeJS Application with Prometheus and Grafana

I am a software engineer. Documenting my DevOps journey
Introduction
Application monitoring is essential in the production environment. Once the application is deployed, the traffic to the application starts increasing, after some time the application starts responding slowly or sometimes it gets failed. That's why monitoring bottlenecks and the health of the system is essential for a quick turnaround in such situations.
So getting insights into what's happening inside the applications is very important. It will help with debugging what went wrong in the production.
There are some tools which will help you to get insights into the application. Prometheus is one such tool which is open source. Prometheus has the following features
It collects the metrics from the server or application by pulling their metric endpoints over HTTP at a predefined time interval.
The core data structure of Prometheus is the time series, which is essentially a list of timestamped values that are grouped by metric.
Prometheus provides a functional query language i.e. PromQL(Prometheus Query Language) allowing for the selection and aggregation of time series data in real time.
A web UI to execute PromQL expressions and visualize the results in a table or graph over time.
It also provides alerting features to send alerts to an alert manager on matching a defined rule and send notifications via email or other platforms.
Whereas Grafana is an open-source analytics platform for data visualization, monitoring and analysis which can be integrated with many different data sources and Prometheus is one of them. You can create, explore, and share dashboards with your team. You can also create alerts on matching query results and send notifications via email or other platforms.
Prerequisite
Docker installed: Prometheus and Grafana both have docker images available, we will be using the same to set up everything locally.
Setup NodeJs Application exposing metrics for Prometheus
Setup NodeJS application
Create a new directory and setup the Node.js project
$ mkdir nodejs-prometheus-app
$ cd nodejs-prometheus-app
$ npm init -y
Install prom-client
prom-client is the Prometheus client library for Node.js. It exports metrics to Prometheus and supports all Prometheus metric types such as histogram, summaries, gauges and counters.
$ npm install prom-client
Exposing Prometheus Metrics with prom-client
Every Prometheus client library comes with predefined default metrics that are assumed to be good for all applications on the specific runtime.
The default metrics are useful for monitoring the usage of resources such as memory and CPU.
For collecting default metrics first we need to create a registry to register the metrics. That registry needs to pass to the collectDefaultMetrics() function.
const client = require('prom-client');

// Create a Registry to register the metrics
const register = new client.Registry()
register.setDefaultLabels({app: 'example-nodejs-app'})
client.collectDefaultMetrics({ register })
You can define custom metrics also, here we are going to capture a metric for HTTP request durations. We will create Histogram for that and register it with the registry. Histogram visualizes request time and the distribution that they have.
const httpRequestDurationMicroseconds = new client.Histogram({
  name: 'http_request_duration_seconds',
  help: 'Duration of HTTP requests in seconds',
  labelNames: ['method', 'route', 'code'],
  buckets: [0.1, 0.3, 0.5, 0.7, 1, 3, 5, 7, 10] // 0.1 to 10 seconds
})

register.registerMetric(httpRequestDurationMicroseconds)
The buckets are simply the labels for our Histogram and refer to the length of requests. If a request takes less than 0.1s to execute, it belongs to the 0.1 bucket.
We can define endpoints which are timed with our httpRequestDurationMicroseconds instance, and logged. We'll also be taking the routes and their return codes and method into consideration.
// Start timer for http request duration metric
const end = httpRequestDurationMicroseconds.startTimer();

//Logged route , methos and status codes also.
end({ route, code: res.statusCode, method: req.method });
Here we will define one endpoint /order which uses a delay handler to delay the response.
Both /metrics and /order route with metric explained earlier is included in the following code.
const http = require('http')
const url = require('url');
const client = require('prom-client')

const register = new client.Registry()

register.setDefaultLabels({
  app: 'example-nodejs-app'
})

client.collectDefaultMetrics({ register })

const httpRequestDurationMicroseconds = new client.Histogram({
  name: 'http_request_duration_seconds',
  help: 'Duration of HTTP requests in seconds',
  labelNames: ['method', 'route', 'code'],
  buckets: [0.1, 0.3, 0.5, 0.7, 1, 3, 5, 7, 10] // 0.1 to 10 seconds
})

register.registerMetric(httpRequestDurationMicroseconds)

const createOrderHandler = async (req, res) => {
  // return an error 1% of the time
  if ((Math.floor(Math.random() * 100)) === 0) {
    throw new Error('Internal Error')
  }

  // delay for 3-6 seconds
  const delaySeconds = Math.floor(Math.random() * (6 - 3)) + 3
  await new Promise(res => setTimeout(res, delaySeconds * 1000))

  res.end('Order created successfully');
}

const server = http.createServer(async (req, res) => {
  const end = httpRequestDurationMicroseconds.startTimer();
  const route = url.parse(req.url).pathname;

  try {
      if (route === '/metrics') {
        res.setHeader('Content-Type', register.contentType)
        let data =  await register.metrics();
        res.end(data)
      }

      if (route === '/order') {
        await createOrderHandler(req, res)
      }

  } catch (error) {
    console.log(error);
    res.writeHead(500).end()
  }

  if (!res.finished) {
    res.writeHead(404).end() // Default 404 handler
  }

  end({ route, code: res.statusCode, method: req.method })
})

server.listen(8000, () => {
  console.log('Server is running on http://localhost:8000, metrics are exposed on http://localhost:8000/metrics')
})
Copy the above code into a file called server.js and start the Node.js HTTP server with the following command:
node server.js
You should now be able to access the metrics via http://localhost:8000/metrics.
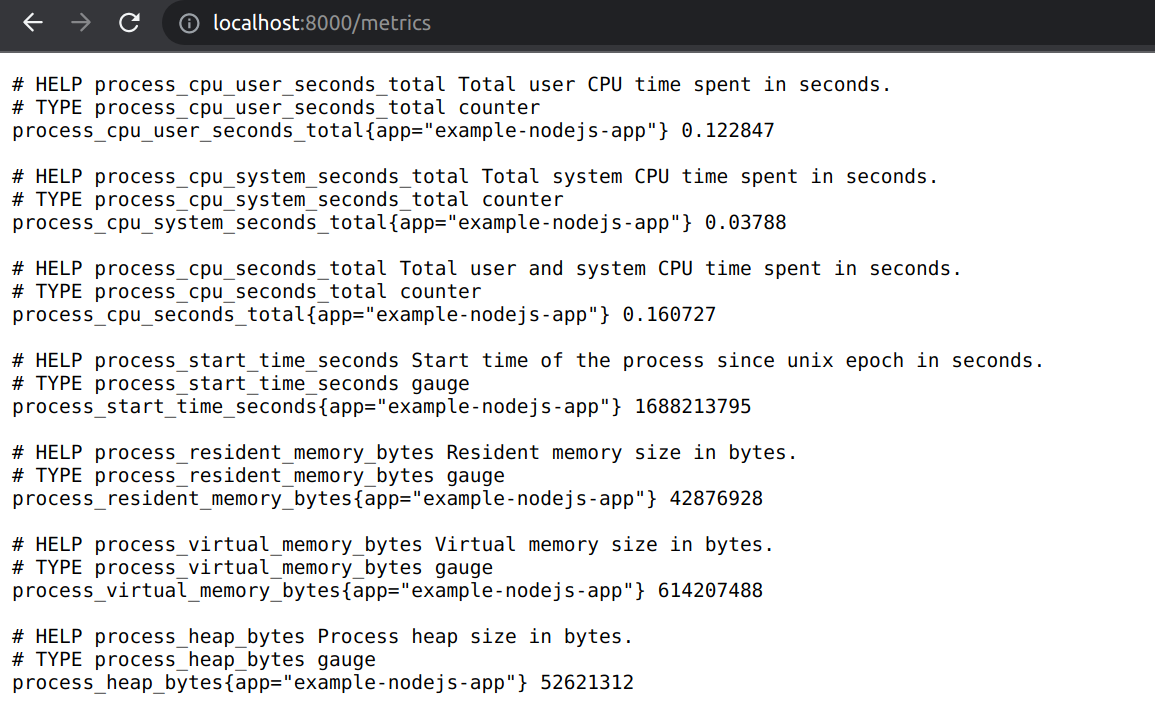
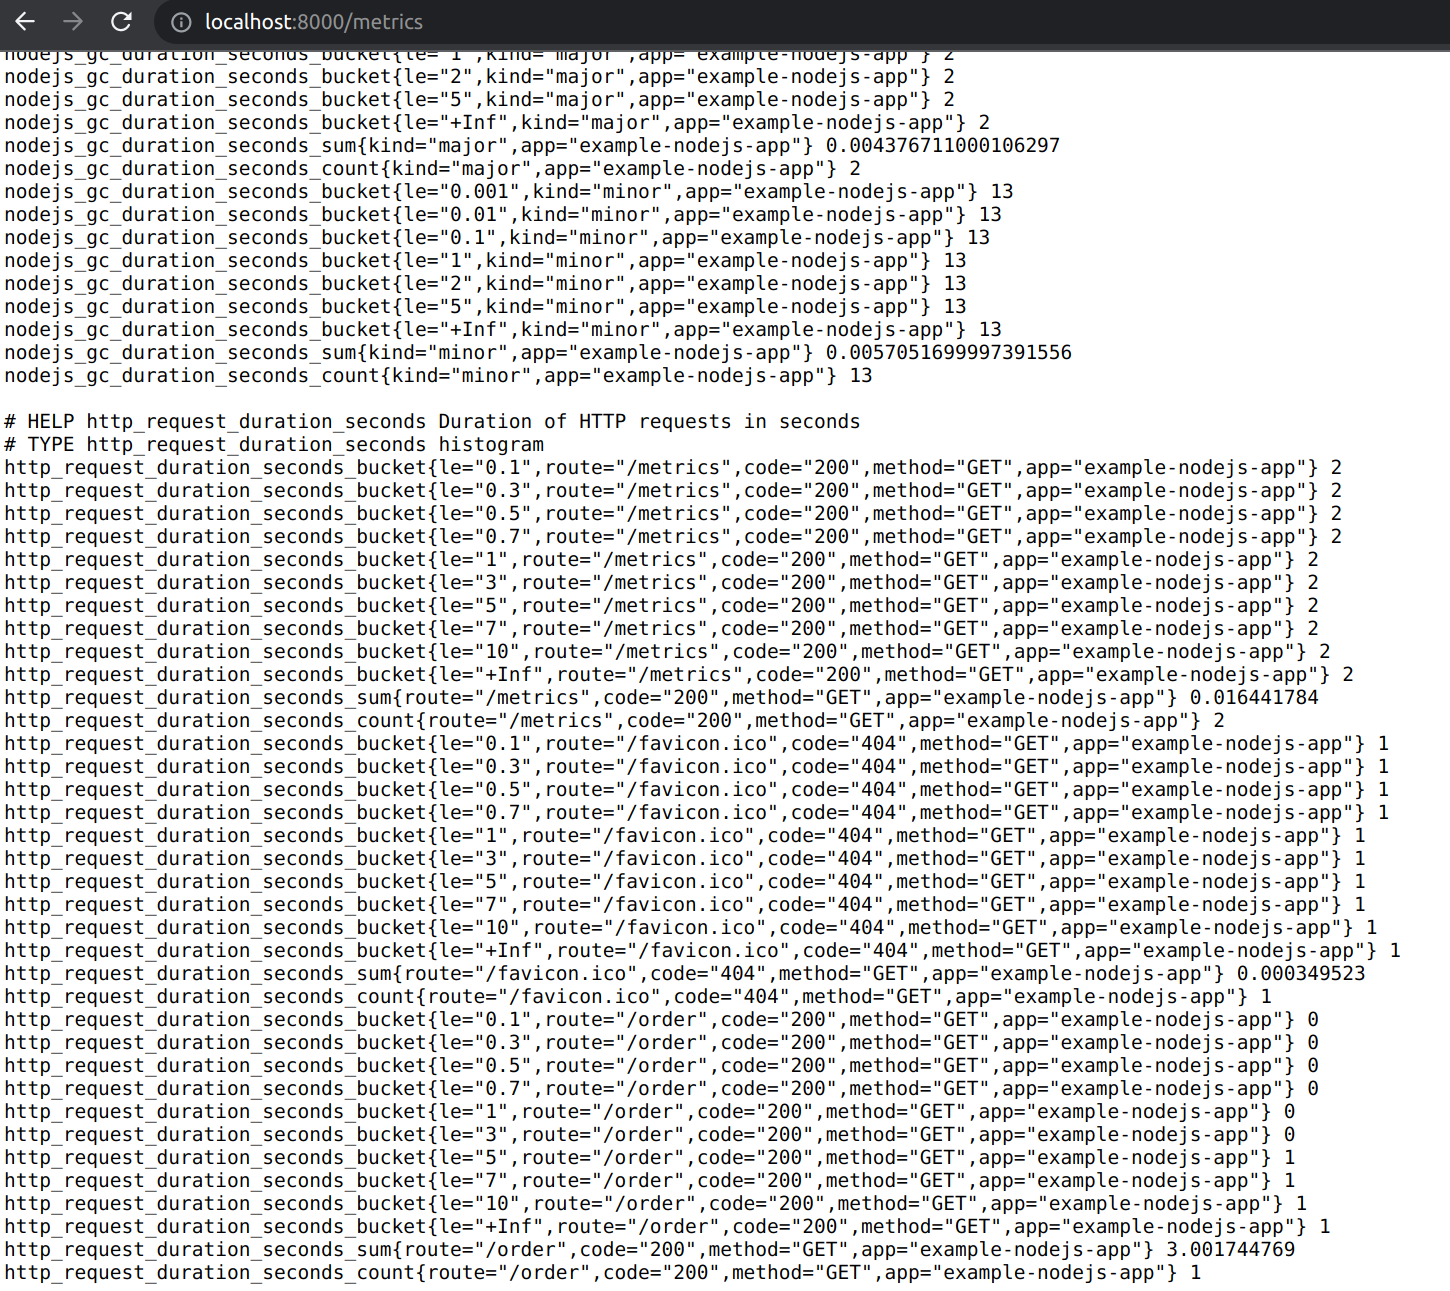
The above screenshot shows default metrics. Let's send a GET request to /order and then observe the /metrics again. The custom metric httpRequestDurationMicroseconds also started appearing. The below screenshot shows the custom metric httpRequestDurationMicroseconds.
Prometheus server setup
We need one server to scrape metrics from the application. The Prometheus server is available as Docker image and can be configured via a YAML file.
Create a directory prometheus-server and create a configuration file called prometheus.yml inside the directory with the following content:
global:
  scrape_interval: 5s
scrape_configs:
  - job_name: "example-nodejs-app"
    static_configs:
      - targets: ["localhost:8000"]
The config file tells Prometheus to scrape all targets every 5 seconds. The targets are defined under scrape_configs. On Mac, you need to use docker.for.mac.host.internal as host, so that the Prometheus Docker container can scrape the metrics of the local Node.js HTTP server. On Windows, use docker.for.win.localhost and for Linux use localhost.
Use the docker run command to start the Prometheus Docker container and mount the configuration file (prometheus.yml) from the directory.
Prometheus data is also mounted from same the directory.
sudo docker run -d --name prometheus2.20.1 --user root --volume "$PWD/data:/prometheus" -p 9090:9090 -v `pwd`/prometheus.yml:/etc/prometheus/prometheus.yml prom/prometheus:v2.20.1
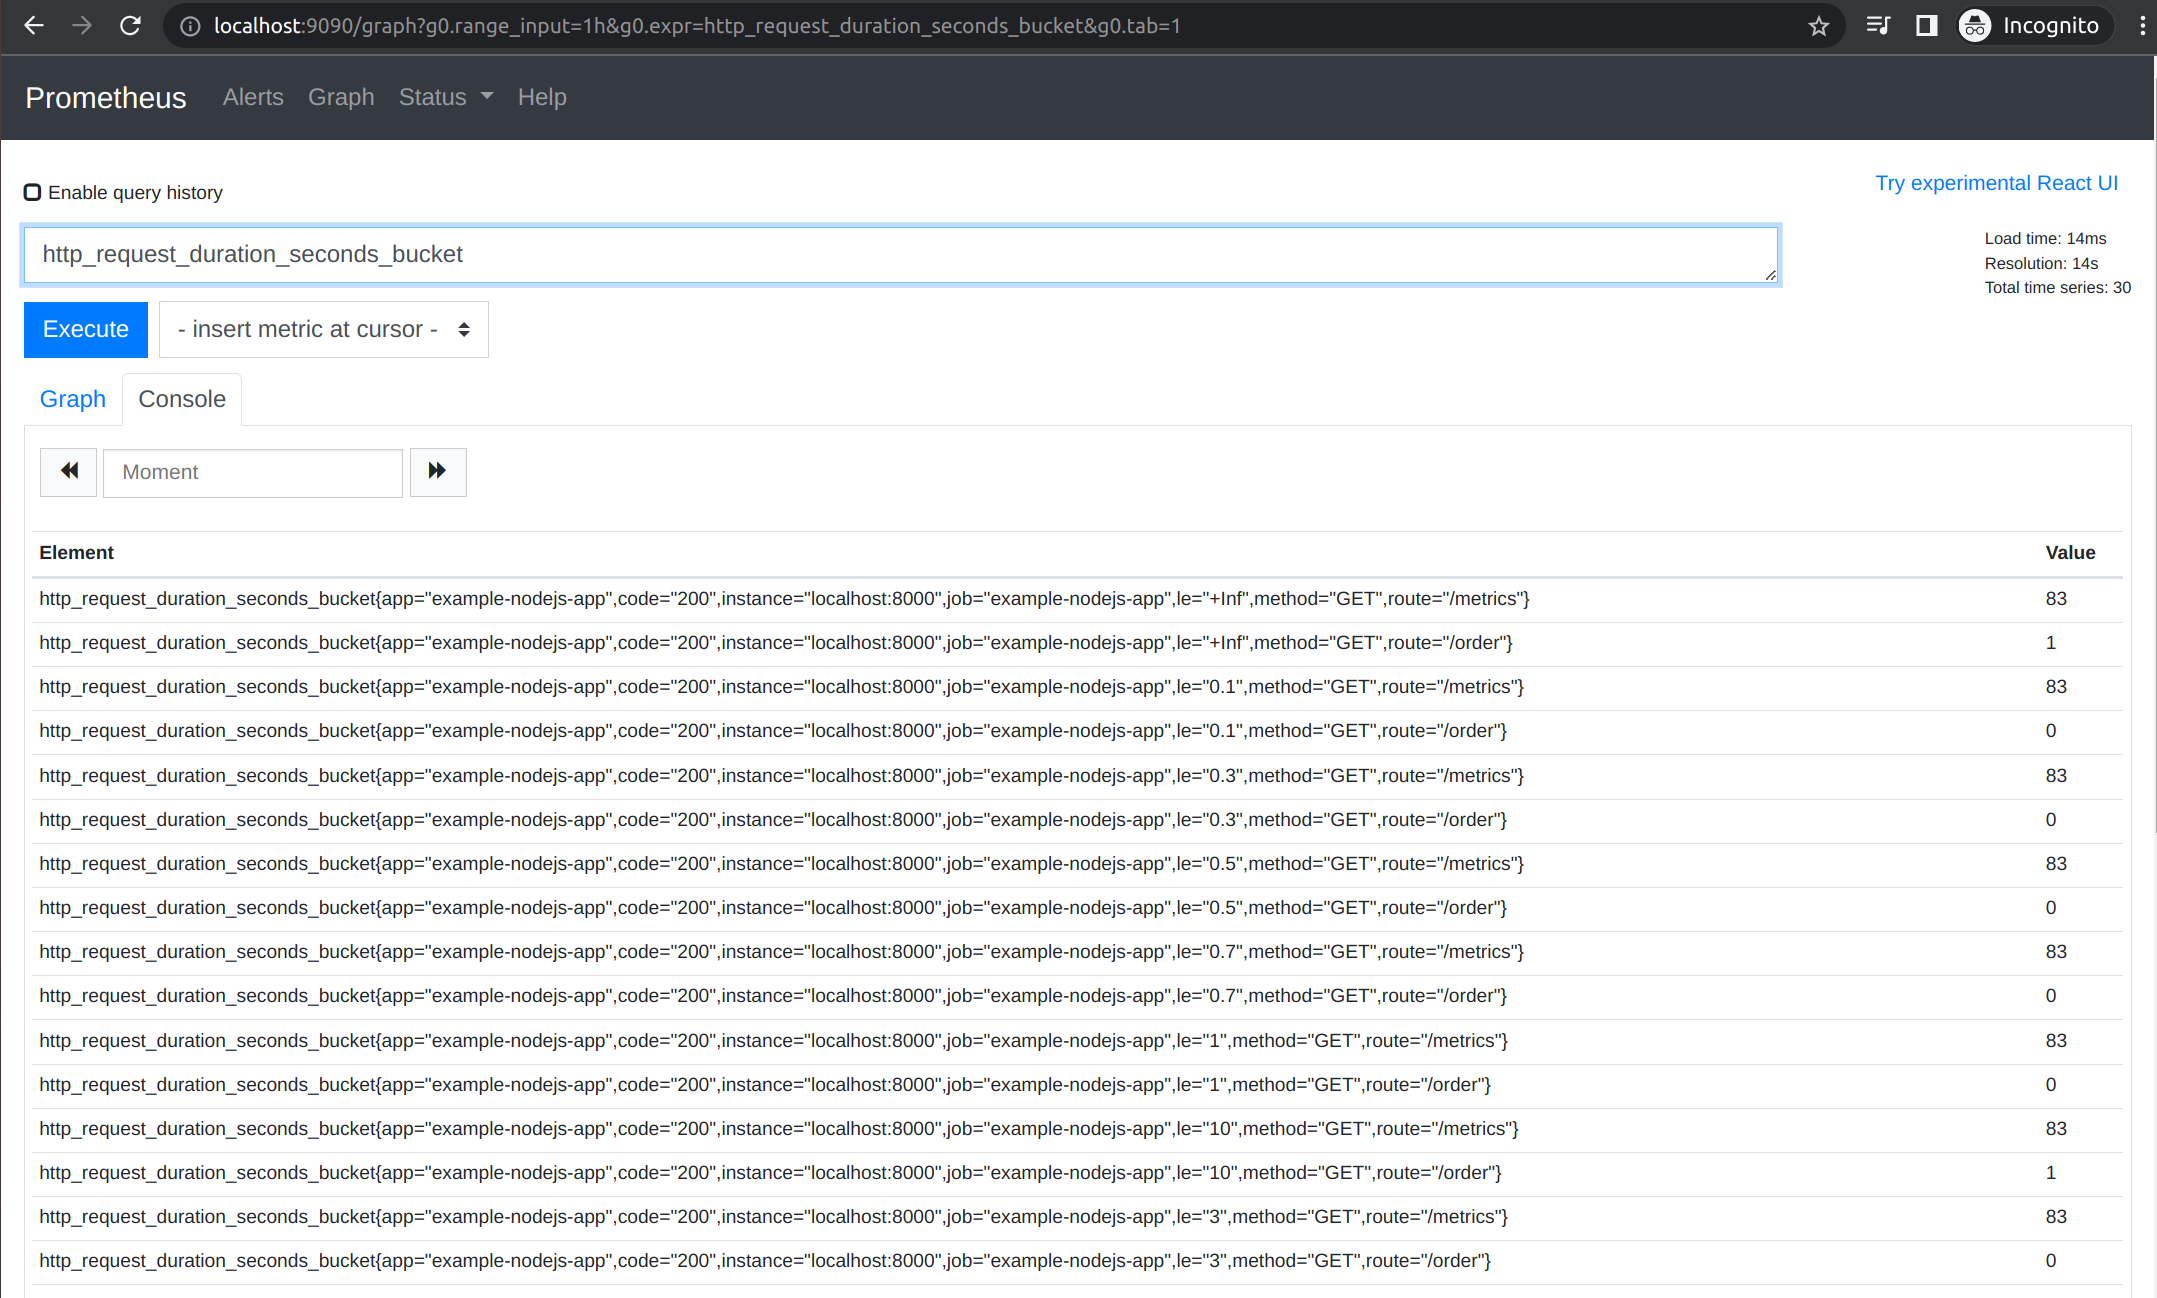
You should now be able to access the Prometheus Web UI on http://localhost:9090
Grafana setup
Grafana is a web application that allows you to visualize data sources. A visualization can be a graph or chart.
The metrics displayed in the Grafana charts come from data sources. Prometheus is one of the supported data sources for Grafana, but it can also use other systems, like AWS CloudWatch, or Azure Monitor.
Grafana also allows you to define alerts that will be triggered if certain issues arise, meaning you’ll receive an email notification if something goes wrong.
Similar to Prometheus docker image is also available for Grafana. Create a directory grafana-server and create a configuration file called datasources.yml inside the directory with the following content:
apiVersion: 1

datasources:
  - name: Prometheus
    type: prometheus
    access: proxy
    orgId: 1
    url: http://localhost:9090
    basicAuth: false
    isDefault: true
    editable: true
Use the docker run command to start the Grafana Docker container and mount the configuration file (datasources.yml) from the directory.
sudo docker run -d --name grafana7.1.5 --user root --volume "$(pwd)/data:/var/lib/grafana" -p 3000:3000 --volume "$(pwd)/datasources.yml:/etc/grafana/provisioning/datasources/datasources.yml" --network="host" grafana/grafana:7.1.5
Grafana data is also mounted from same the directory. We have everything running inside containers in a docker. So Grafana container won't be able to access the localhost on our machine, so we have specified --network=host to access the Prometheus server from our local machine.
Now open up localhost:3000 and you will be seeing Grafana’s login page. Using the admin credentials we can log in to grafana.
username - admin
password - admin
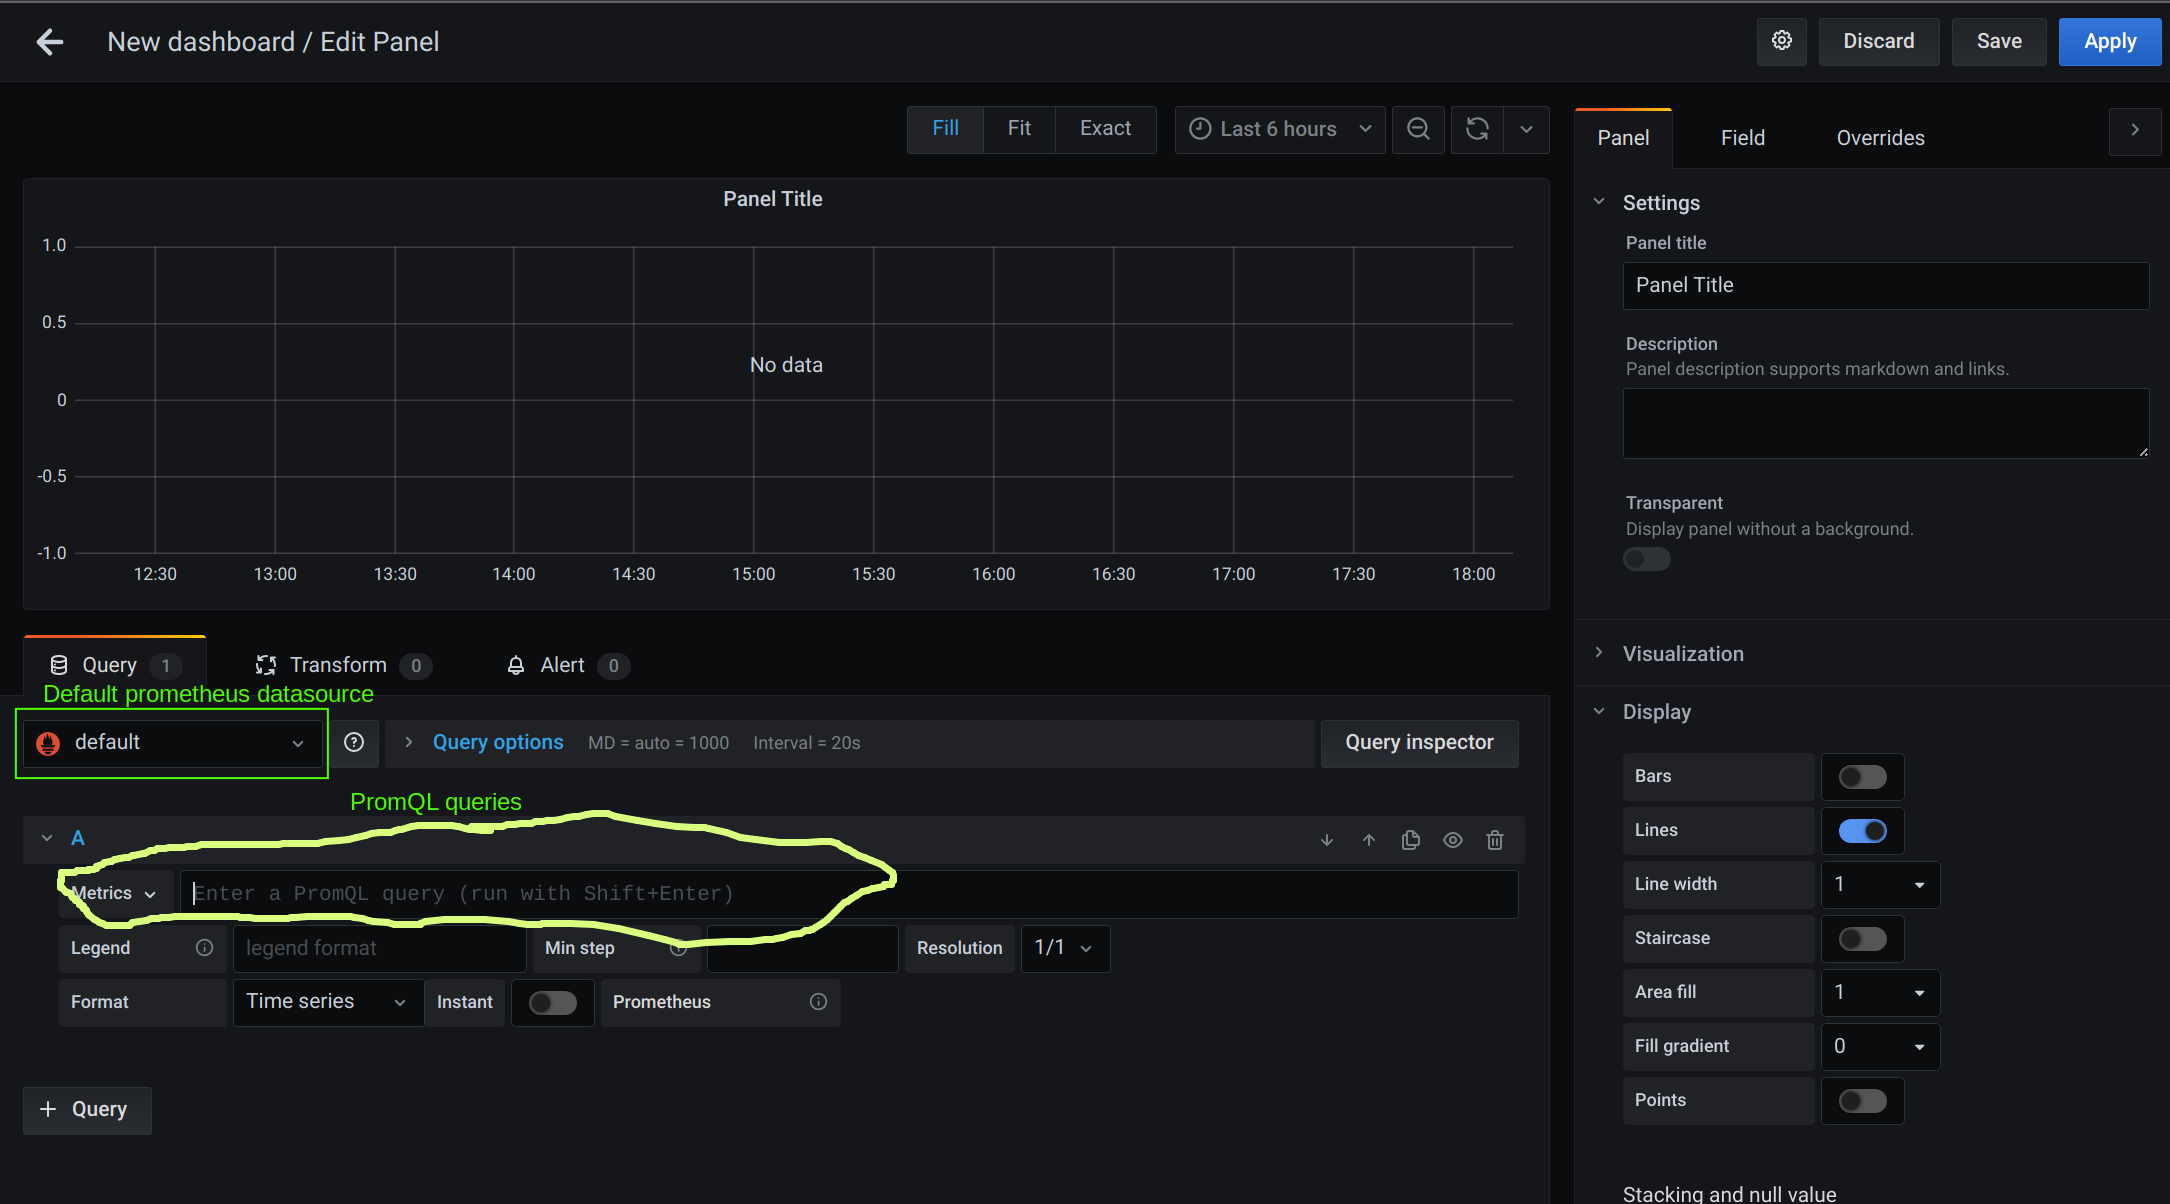
Let's add a dashboard to visualize the metrics received from the application through Prometheus. Click on “Create your first dashboard” and then on “Add new panel”. On to the new panel goto to "Metrics" section where we can write PromQL query to fetch data from the Prometheus server setup earlier.
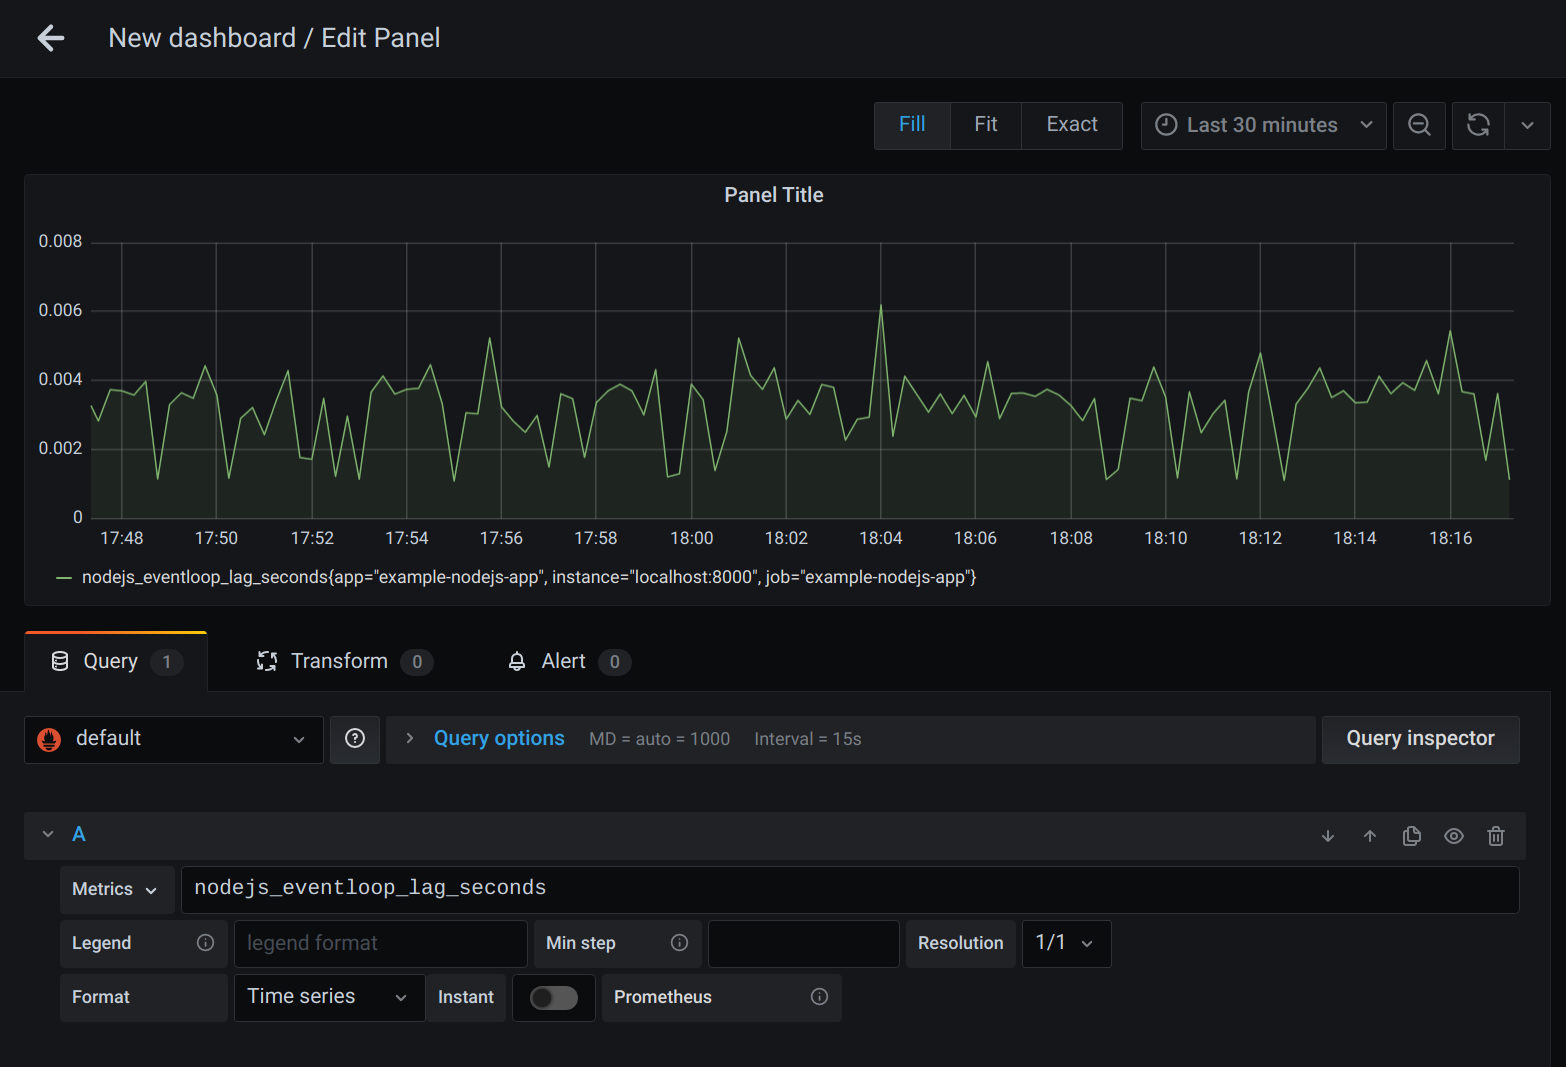
So basically if you type out nodejs_eventloop_lag_seconds in the query section you will get the same kind of graph as shown below.
Using PromQL we can run our metrics through many different functions and derive graphs out of these. We can perform many arithmetic operations on our time series data like taking all the values in the last x minutes and finding its average or the maximum of all the values. You can find out more about PromQL here. Some of the common questions we ask about our APIs can be derived from these graphs.
Following are some query examples to know more about running NodeJs application very well.
- Rate of requests in the last 5 minutes
sum(rate(http_request_duration_seconds_count[5m]))
- Rate of 5xx responses we got from our server
sum(rate(http_request_duration_seconds_count{code=”500"}[5m]))
- Memory usage chart
avg(node_nodejs_external_memory_bytes / 1024) by (route)
Grafana comes with many different forms of visualizations like Graph, Histograms, Gauges and more based on different use cases.
From these graphs we can set up alerts based on some conditions, for example for our graph showing the rate of 5xx responses, since 5xx responses are not something we want our end users to see, we can set up a condition that whenever this rate goes above some threshold for some continuous period then trigger an alert. We can have another alert on how much is the average latency of our APIs and trigger alerts if the value is constantly above some threshold for some time. Grafana can alert its users through many channels like Email, Slack, etc.
Conclusion
Prometheus and Grafana are powerful open-source tools for application monitoring and sending alerts when an unwanted situation comes.