Monitor Linux Host Metrics With The Node Exporter

I am a software engineer. Documenting my DevOps journey
Introduction
In the last article, we discovered how to monitor a NodeJs application with Prometheus and Grafana. In that, we learned to collect metrics from the application like the rate of requests in the last 5 minutes, the rate of 5xx responses, but these metrics are of the application only, we want to monitor the server which has hosted this application.
The Prometheus Node Exporter exposes a wide variety of hardware- and kernel-related metrics of host machine.
Installing Node Exporter
As the first step, you need to download the Node Exporter binary which is available for Linux on the Prometheus website here.
Copy the .tar.gz URL and download it somewhere in your server using wget.
wget https://github.com/prometheus/node_exporter/releases/download/v1.6.1/node_exporter-1.6.1.linux-amd64.tar.gz
Extract Node Exporter and move binary
After downloading the latest version of Node Exporter, proceed to extract the content of the downloaded tar using the following command
tar xvf node_exporter-1.6.1.linux-amd64.tar.gz
Now switch to the node_exporter directory.
cd node_exporter-1.6.1.linux-amd64/
You only need to move the binary file node_exporter to the /usr/local/bin directory of your system using the following command
sudo cp node_exporter /usr/local/bin
Create Node Exporter User
Create a user in the system for Node Exporter with the following command
sudo useradd --no-create-home --shell /bin/false node_exporter
Now set the owner of the binary node_exporter to the recently created user with the following command
sudo chown node_exporter:node_exporter /usr/local/bin/node_exporter
Create the Node Exporter service
We must create the service of the Node Exporter, which should always start when the server boots so it will always be available to be scrapped metrics.
So create the node_exporter.service file in the directory /etc/systemd/system/
sudo touch /etc/systemd/system/node_exporter.service
And paste the following content into the file
[Unit]
Description=Node Exporter
Wants=network-online.target
After=network-online.target

[Service]
User=node_exporter
Group=node_exporter
Type=simple
ExecStart=/usr/local/bin/node_exporter
Restart=always
RestartSec=3

[Install]
WantedBy=multi-user.target
Save the file and reload the daemon with the following command
sudo systemctl daemon-reload
And finally, enable the node_exporter service with the following command
sudo systemctl enable node_exporter
Then start the service with the following command
sudo systemctl start node_exporter
Test the Node Exporter
As the last step, access your server through the web browser at port 9100 and browse the metrics (http://your_server_ip:9100/metrics). You should get an output in the browser similar to following
# HELP go_gc_duration_seconds A summary of the pause duration of garbage collection cycles.
# TYPE go_gc_duration_seconds summary
go_gc_duration_seconds{quantile="0"} 2.5948e-05
go_gc_duration_seconds{quantile="0.25"} 2.9566e-05
go_gc_duration_seconds{quantile="0.5"} 3.0488e-05
go_gc_duration_seconds{quantile="0.75"} 3.2111e-05
go_gc_duration_seconds{quantile="1"} 0.000232387
go_gc_duration_seconds_sum 1.454063444
go_gc_duration_seconds_count 23486
# HELP go_goroutines Number of goroutines that currently exist.
# TYPE go_goroutines gauge
go_goroutines 9
# HELP go_info Information about the Go environment.
# TYPE go_info gauge
go_info{version="go1.17.3"} 1
# HELP go_memstats_alloc_bytes Number of bytes allocated and still in use.
# TYPE go_memstats_alloc_bytes gauge
go_memstats_alloc_bytes 2.365264e+06
# HELP go_memstats_alloc_bytes_total Total number of bytes allocated, even if freed.
# TYPE go_memstats_alloc_bytes_total counter
go_memstats_alloc_bytes_total 5.0367212352e+10
# HELP go_memstats_buck_hash_sys_bytes Number of bytes used by the profiling bucket hash table.
# TYPE go_memstats_buck_hash_sys_bytes gauge
go_memstats_buck_hash_sys_bytes 1.897095e+06
If you get some information at the mentioned URL, then your service has been properly configured and it's ready to be scrapped by Prometheus
Add a new target in the Prometheus server
As we have seen setup of Prometheus server using the docker container in this article. We know Prometheus server configuration file prometheus.yml. So now add a new config at the bottom as given below
- job_name: example_server
  static_configs:
  - targets: ['<server_ip>:9100']
Restart the Prometheus server by restarting the Prometheus docker container. Check the new target added for scrapping, by browsing Prometheus server UI.
Grafana Setup
We have seen the set-up of Grafana in this article and we already know that by using PromQL we can run our metrics through many different functions and derive graphs out of these.
Following are some examples to know about server resources using graphs in the Grafana dashboard.
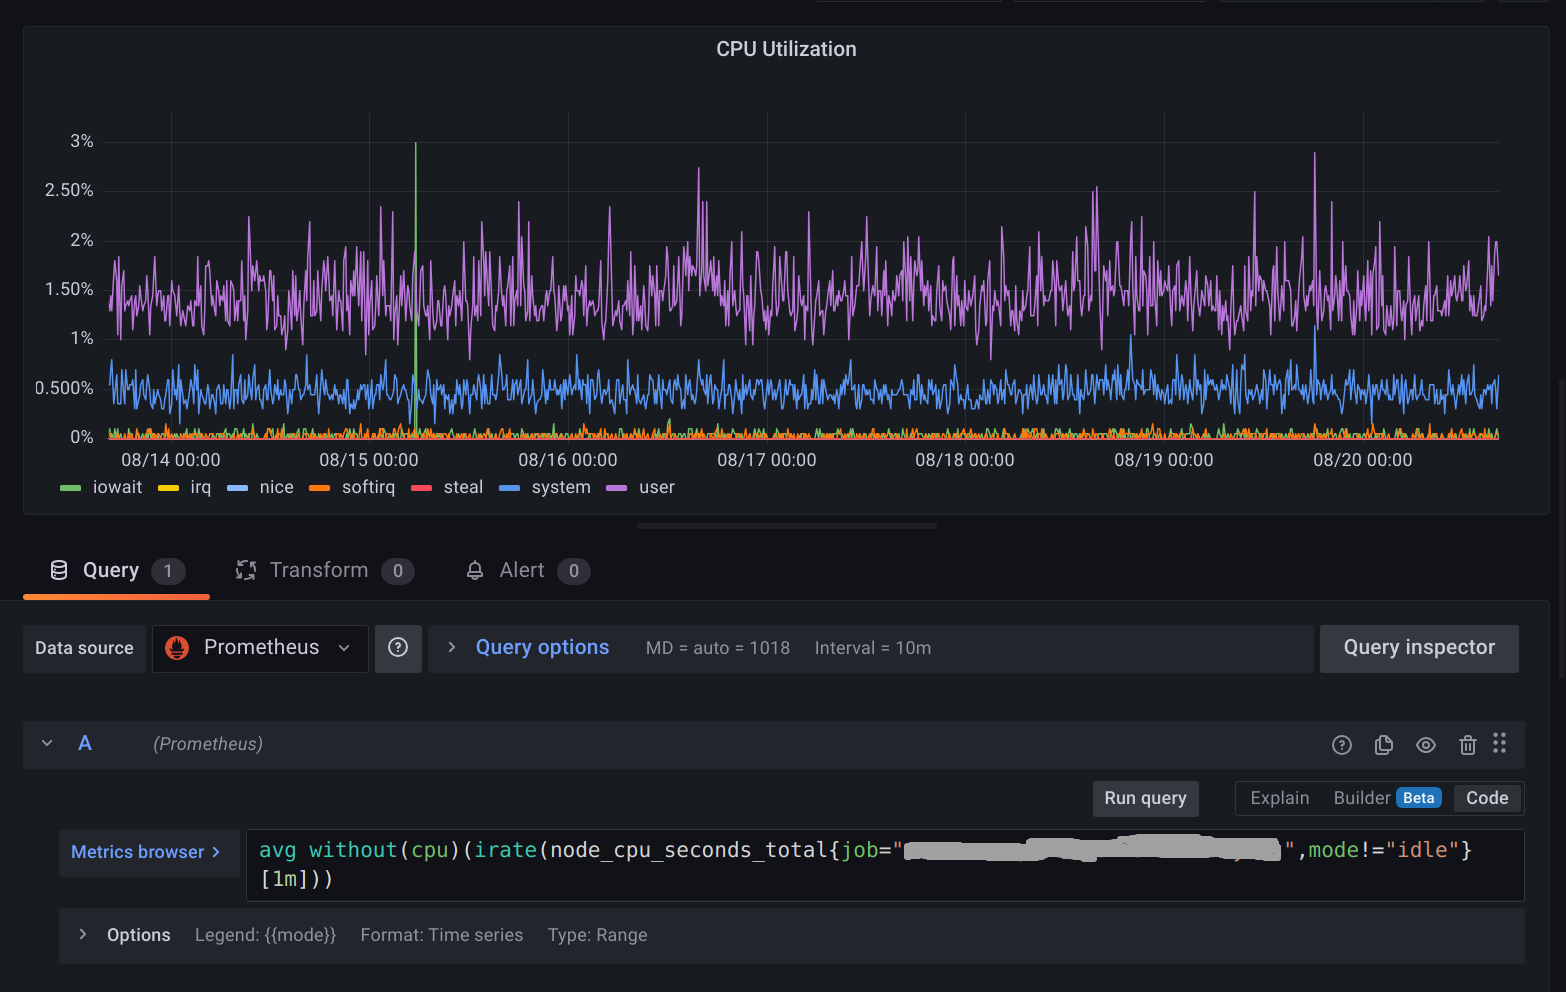
CPU Utilization
avg without(cpu)(irate(node_cpu_seconds_total{job="example_server",mode!="idle"}[1m]))
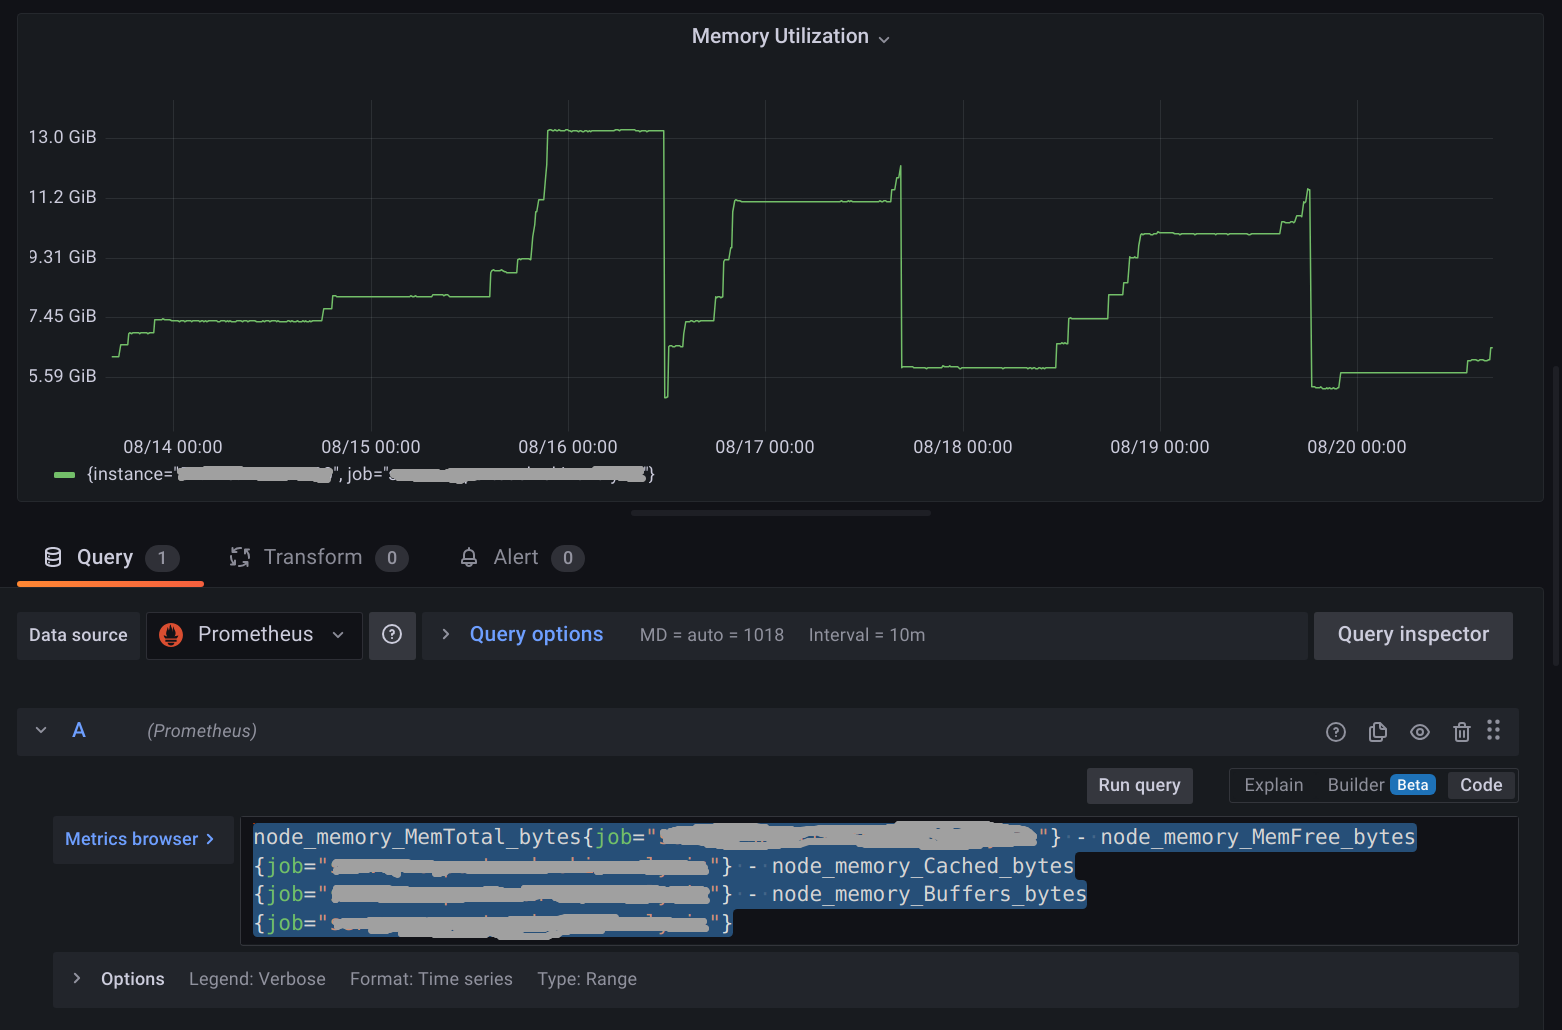
Memory Utilization
node_memory_MemTotal_bytes{job="example_server"} - node_memory_MemFree_bytes{job="example_server"} - node_memory_Cached_bytes{job="example_server"} - node_memory_Buffers_bytes{job="example_server"}
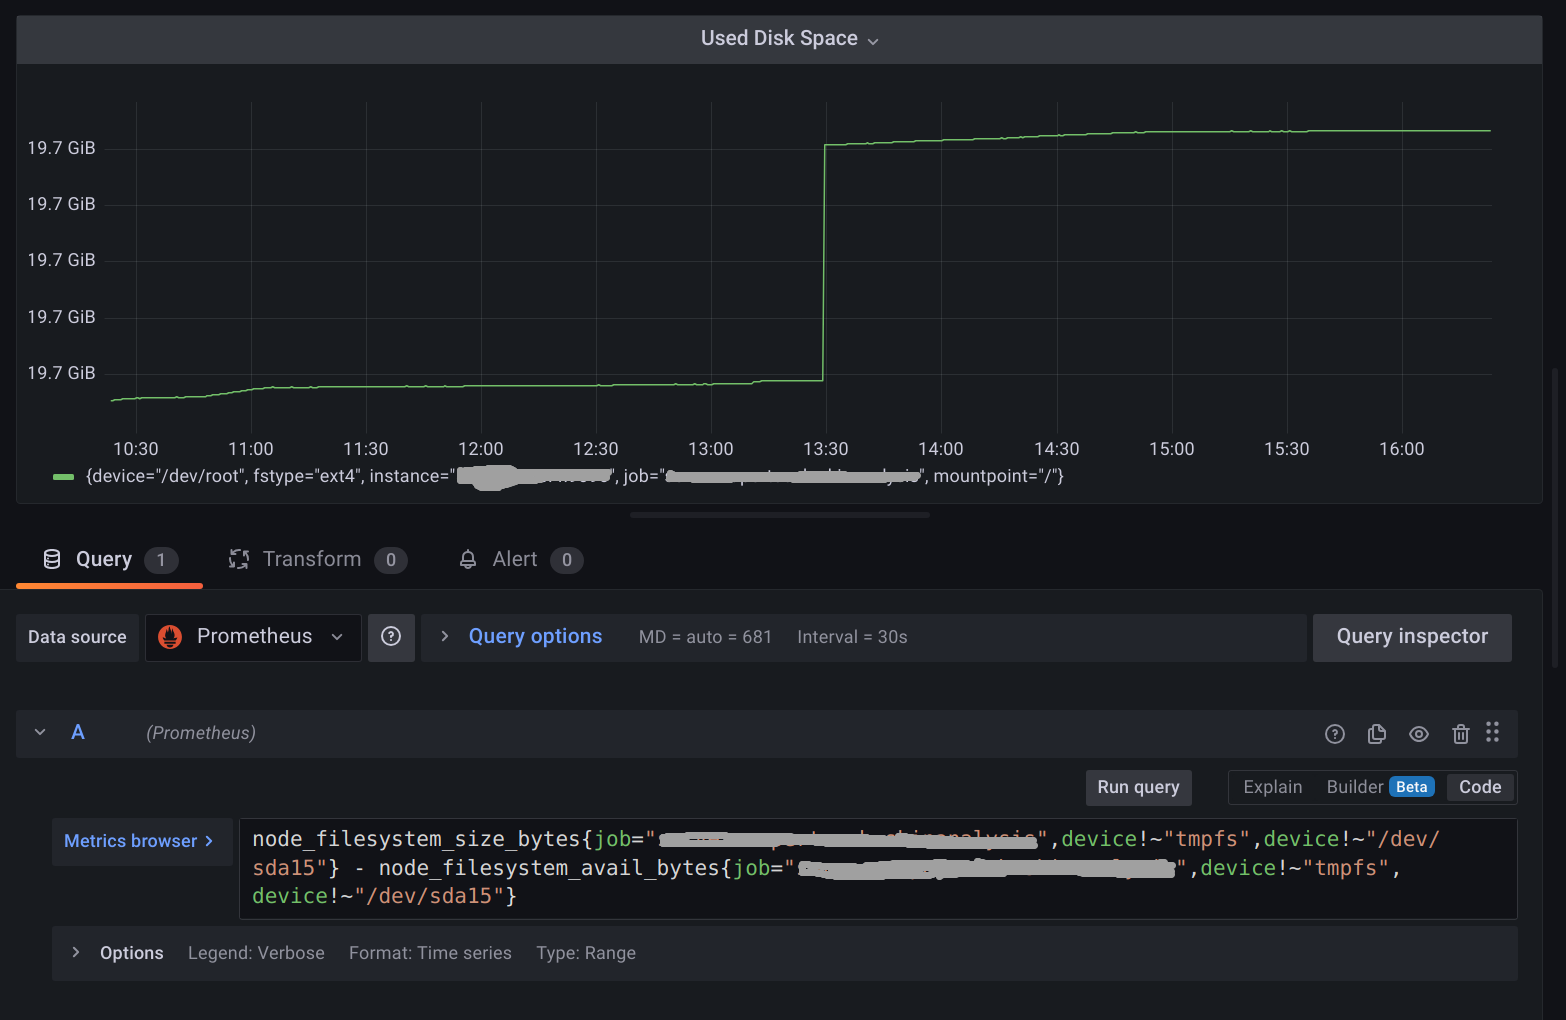
Disk Utilization
node_filesystem_size_bytes{job="example_server",device!~"tmpfs",device!~"/dev/sda15"} - node_filesystem_avail_bytes{job="example_server",device!~"tmpfs",device!~"/dev/sda15"}
Conclusion
The node exporter helps to monitor the host machine and solve critical issues related to the resources CPU, Memory, Disk etc. We can send alerts when any resource is about to exhaust soon.